Internal Standard
Overview
The Internal standard functionality allows you to calculate unknown substances (e.g. decomposition products) with a known amount of a standard (e.G. parent substance) on the same track by:
Defining a substance of the evaluation as Internal Standard. This internal standard is then defined on each track, and must have the same quantity applied across all tracks and be known to behave similarly to the other substances defined in the evaluation in order for the Internal Standard to make sense.
Computing, for each track, the deviation of the peak height/area of the Internal Standard on this track compared to the average peak height/area on reference tracks.
Computing, for each track, the ratio of peak heights/areas between the Internal Standard substance and the other ones.
Defining the Internal Standard
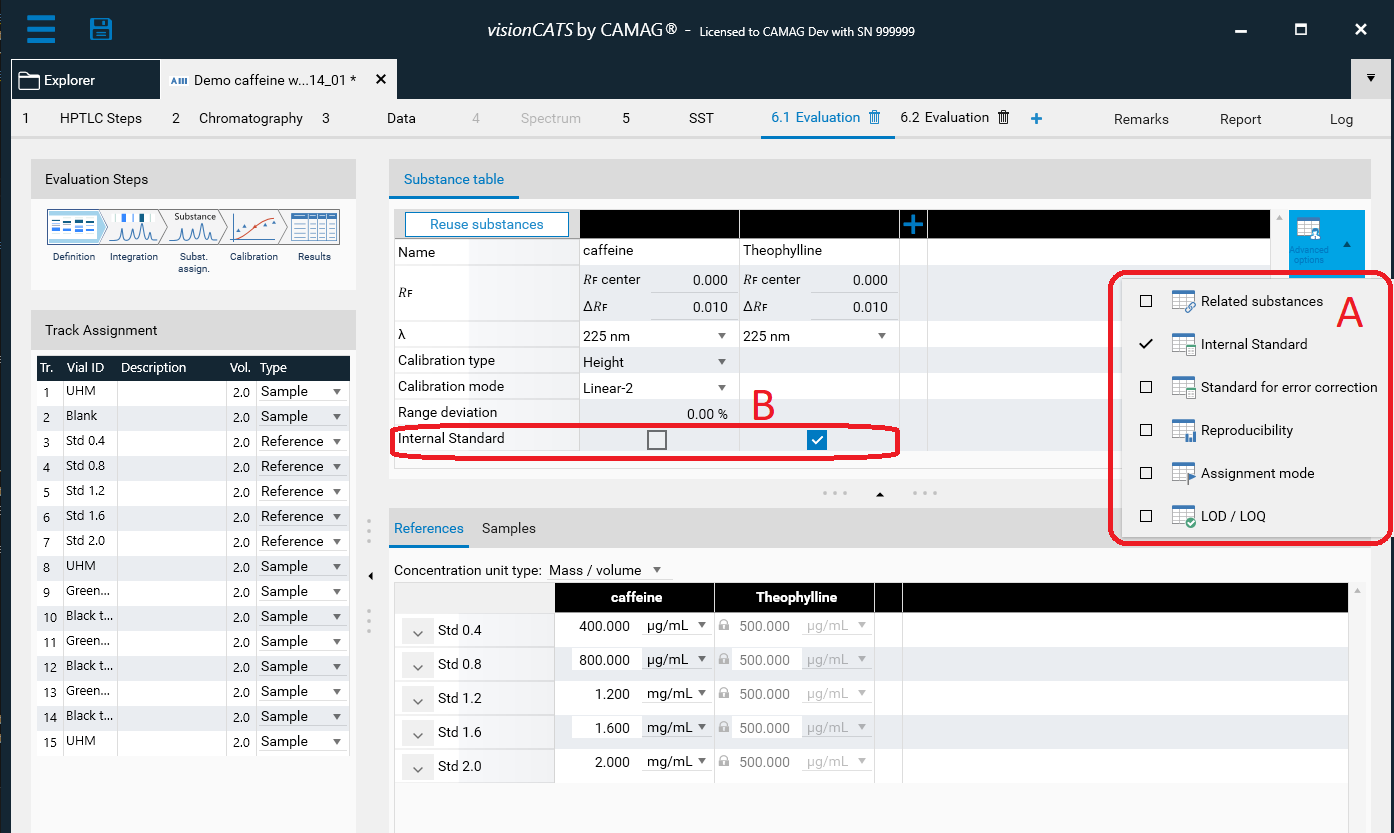
In the Definition tab of the evaluation, use the Advanced options (A) button to make the Internal Standard (B) field appear. In an evaluation, there can be only one Internal Standard. Because the Internal Standard is not itself calibrated, its calibration-related fields are hidden.
During the calibration
During the Calibration phase, displaying the Internal Standard substance makes a table appear where the measured deviations are shown for each track.
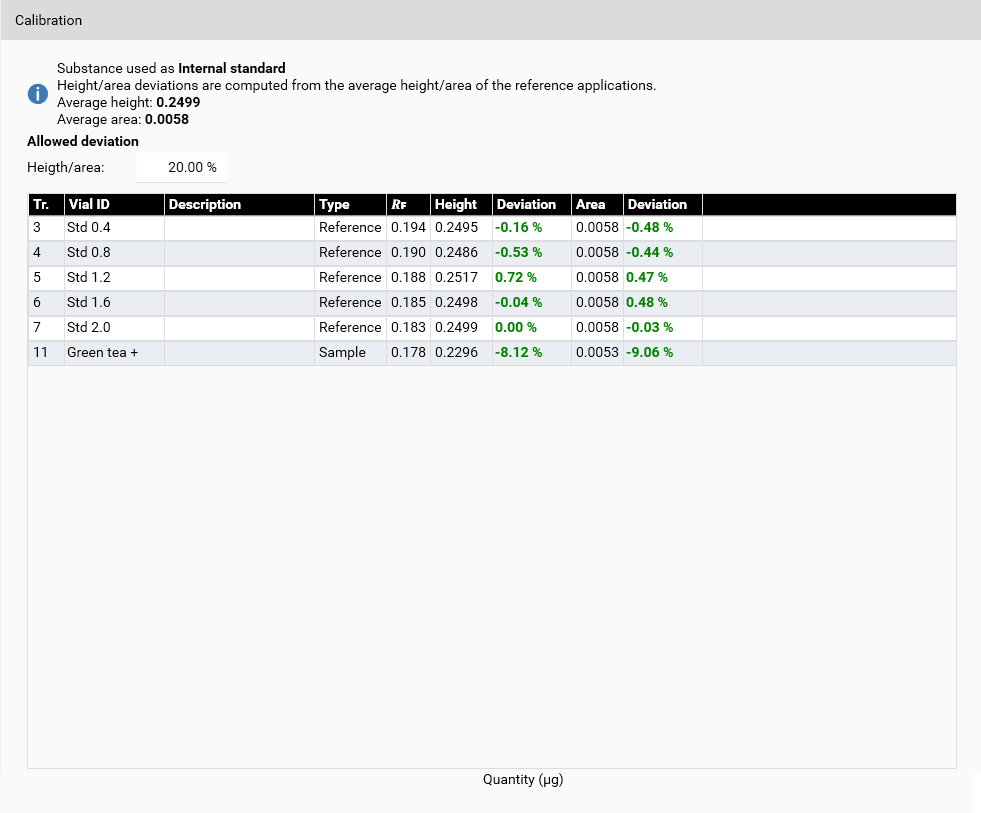
For each reference track (here, the tracks from 3 to 7), the average height and area of the assigned peaks for the Internal Standard are computed and shown on the top information box (here, 0.2499 and 0.0058 respectively). The Deviation columns show the relative difference of the peak height/area compared to the average peak/area. For example, the track 3 had a peak height of 0.2495, which is 0.16% lower than the average height 0.2688.
The Allowed deviation box defines a maximum deviation for the Internal Standard. If a deviation exceeds the limit, then the Internal Standard fails and no results are computed at all for the whole evaluation.
When displaying another substance, the tooltip gives the details of the Internal Standard:
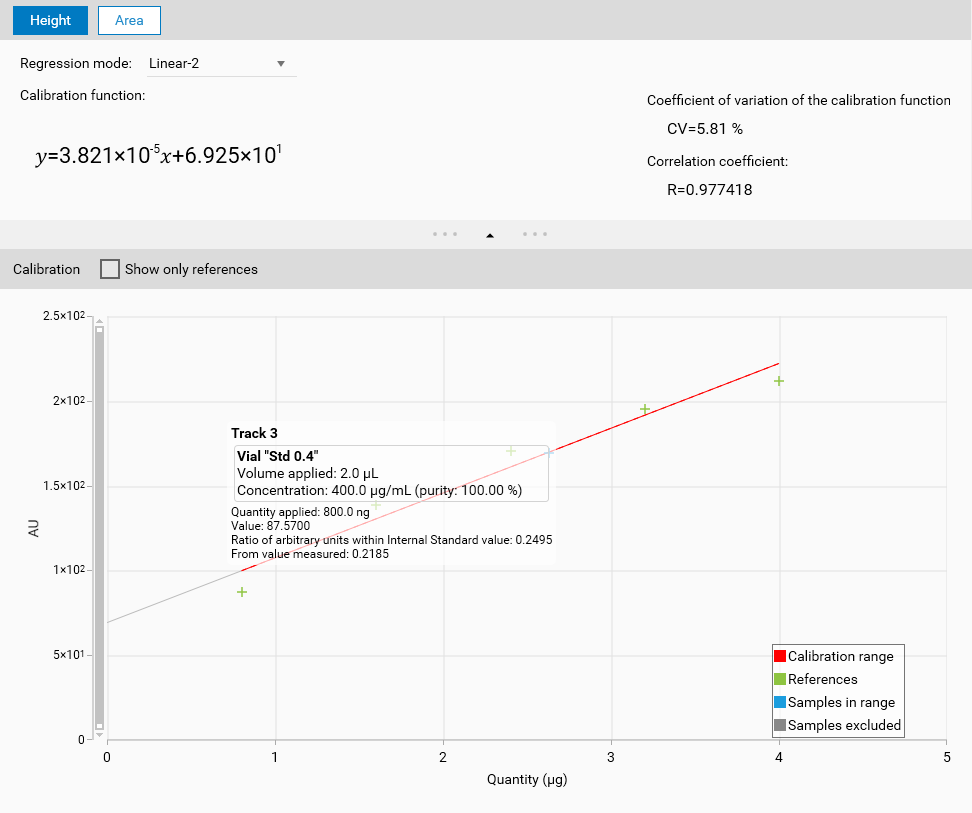
Here, the measured height of the peak was 0.2185, the value for the Internal Standard substance was of 0.2495. The calibration curve is then computed by using the ratio of arbitrary units within Internal Standard value, here 87.57.
In the results
The Results tab simply shows an information text indicating the Internal Standard computation, if any.