How to Use Profile Comparison — Classification (step-by-step)
Prerequisites
Make sure the comparison contains the samples and tracks you want to analyze.
Clean profiles as needed (bounds, smoothing, baseline correction, normalization) before modeling.
For supervised workflows, prepare representative labeled tracks for each class.
Layout overview

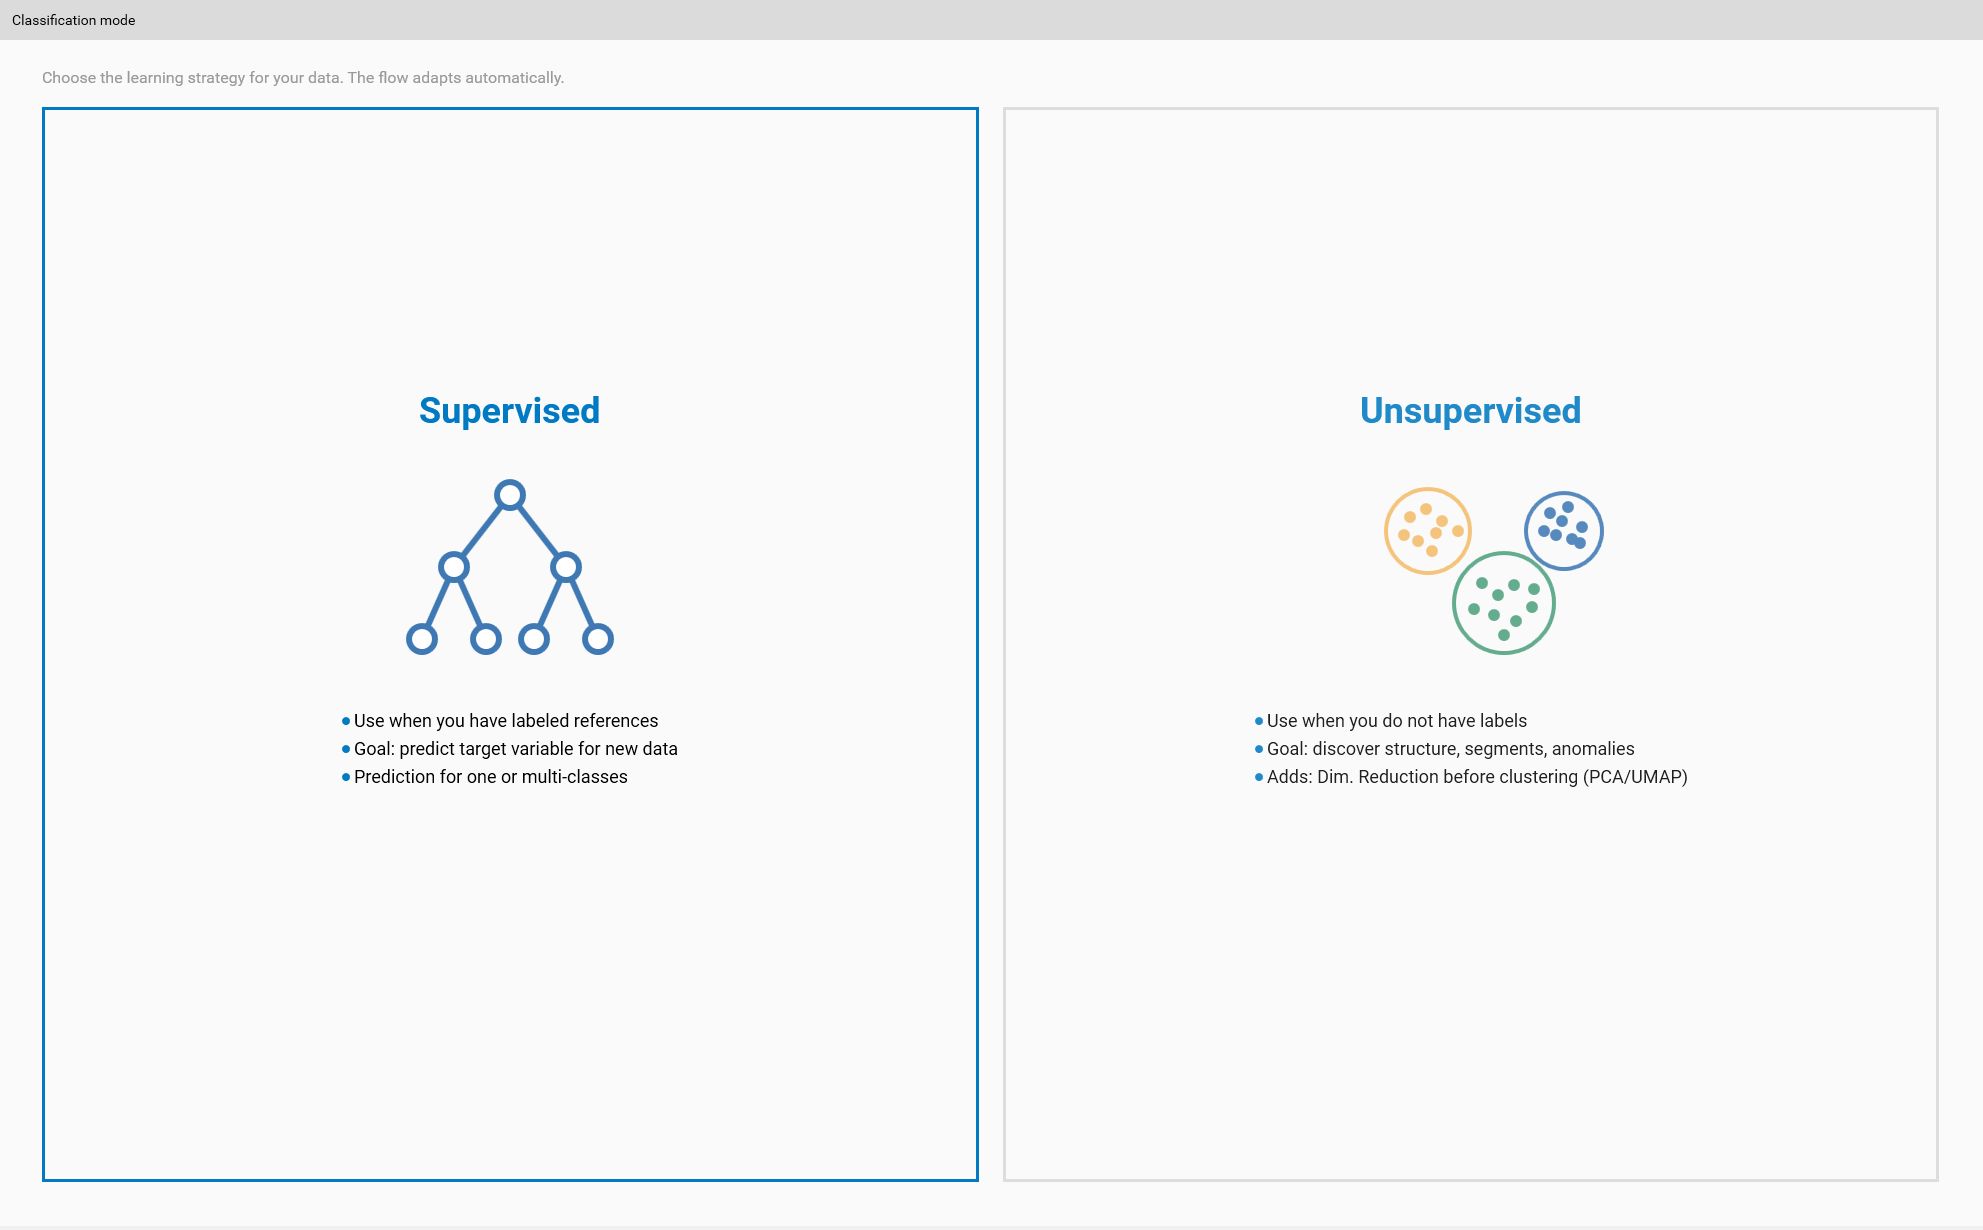
Step 1 — Choose classification mode (Modes)
Goal: pick the overall approach that fits your objective.
Actions:
Open the Classification mode selector.
Choose one of:
Unsupervised — discover structure and clusters without labels.
Supervised One-Class — model a single reference class to detect deviations.
Supervised Multi-Class — train models to discriminate multiple labeled classes.
Tips:
If you have labeled, representative examples for each desired class, prefer Multi-Class.
If you only have a reference ‘good’ condition, use One-Class for anomaly detection.
Visual:
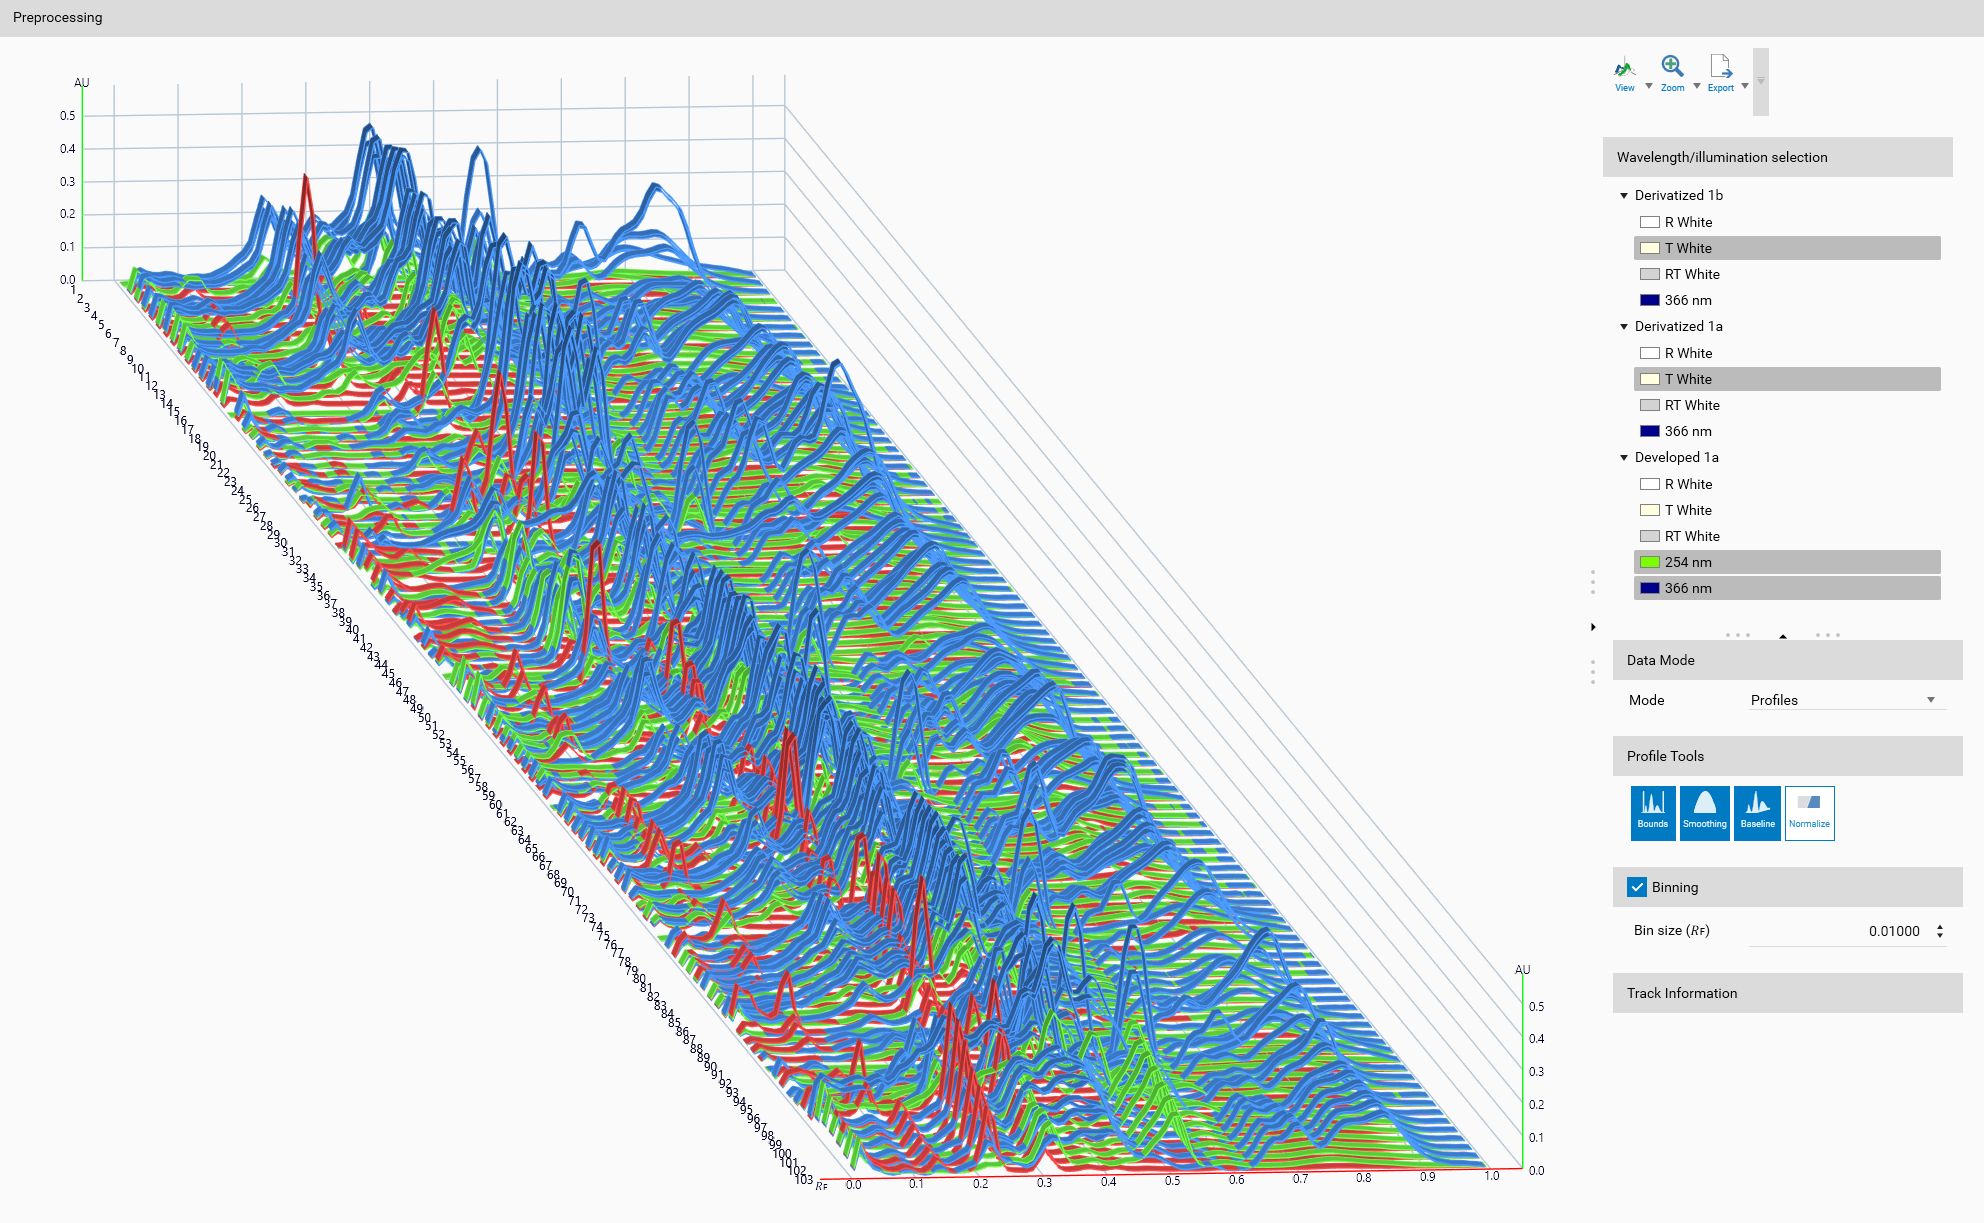
Step 2 — Preprocessing (Wavelengths, Data Mode, Profile Tools)
Goal: make data comparable and reduce noise so your model learns signal, not artifacts.
Ordered actions (follow this order):
Wavelength / illumination selection
Choose one or several wavelengths/illuminations with usable signal across samples.
If some samples lack a selection, either pick another wavelength or exclude those samples.
Data Mode: Profiles vs Peaks
Profiles: use full profile shapes (recommended when shapes are informative and consistent).
Peaks: use peak descriptors (max Rf, height, FWHM) when peaks encode the information or profiles are noisy.
Profile Tools (apply as needed and in roughly this order):
Bounds: trim out irrelevant regions (front, pre-sample areas).
Baseline correction: remove background offsets.
Smoothing: reduce high-frequency noise.
Normalization: scale amplitudes to make samples comparable.
Binning (optional, Profiles only)
Use binning to reduce dimensionality and smooth noise. Pick a bin size that preserves meaningful features.
Visual / example:
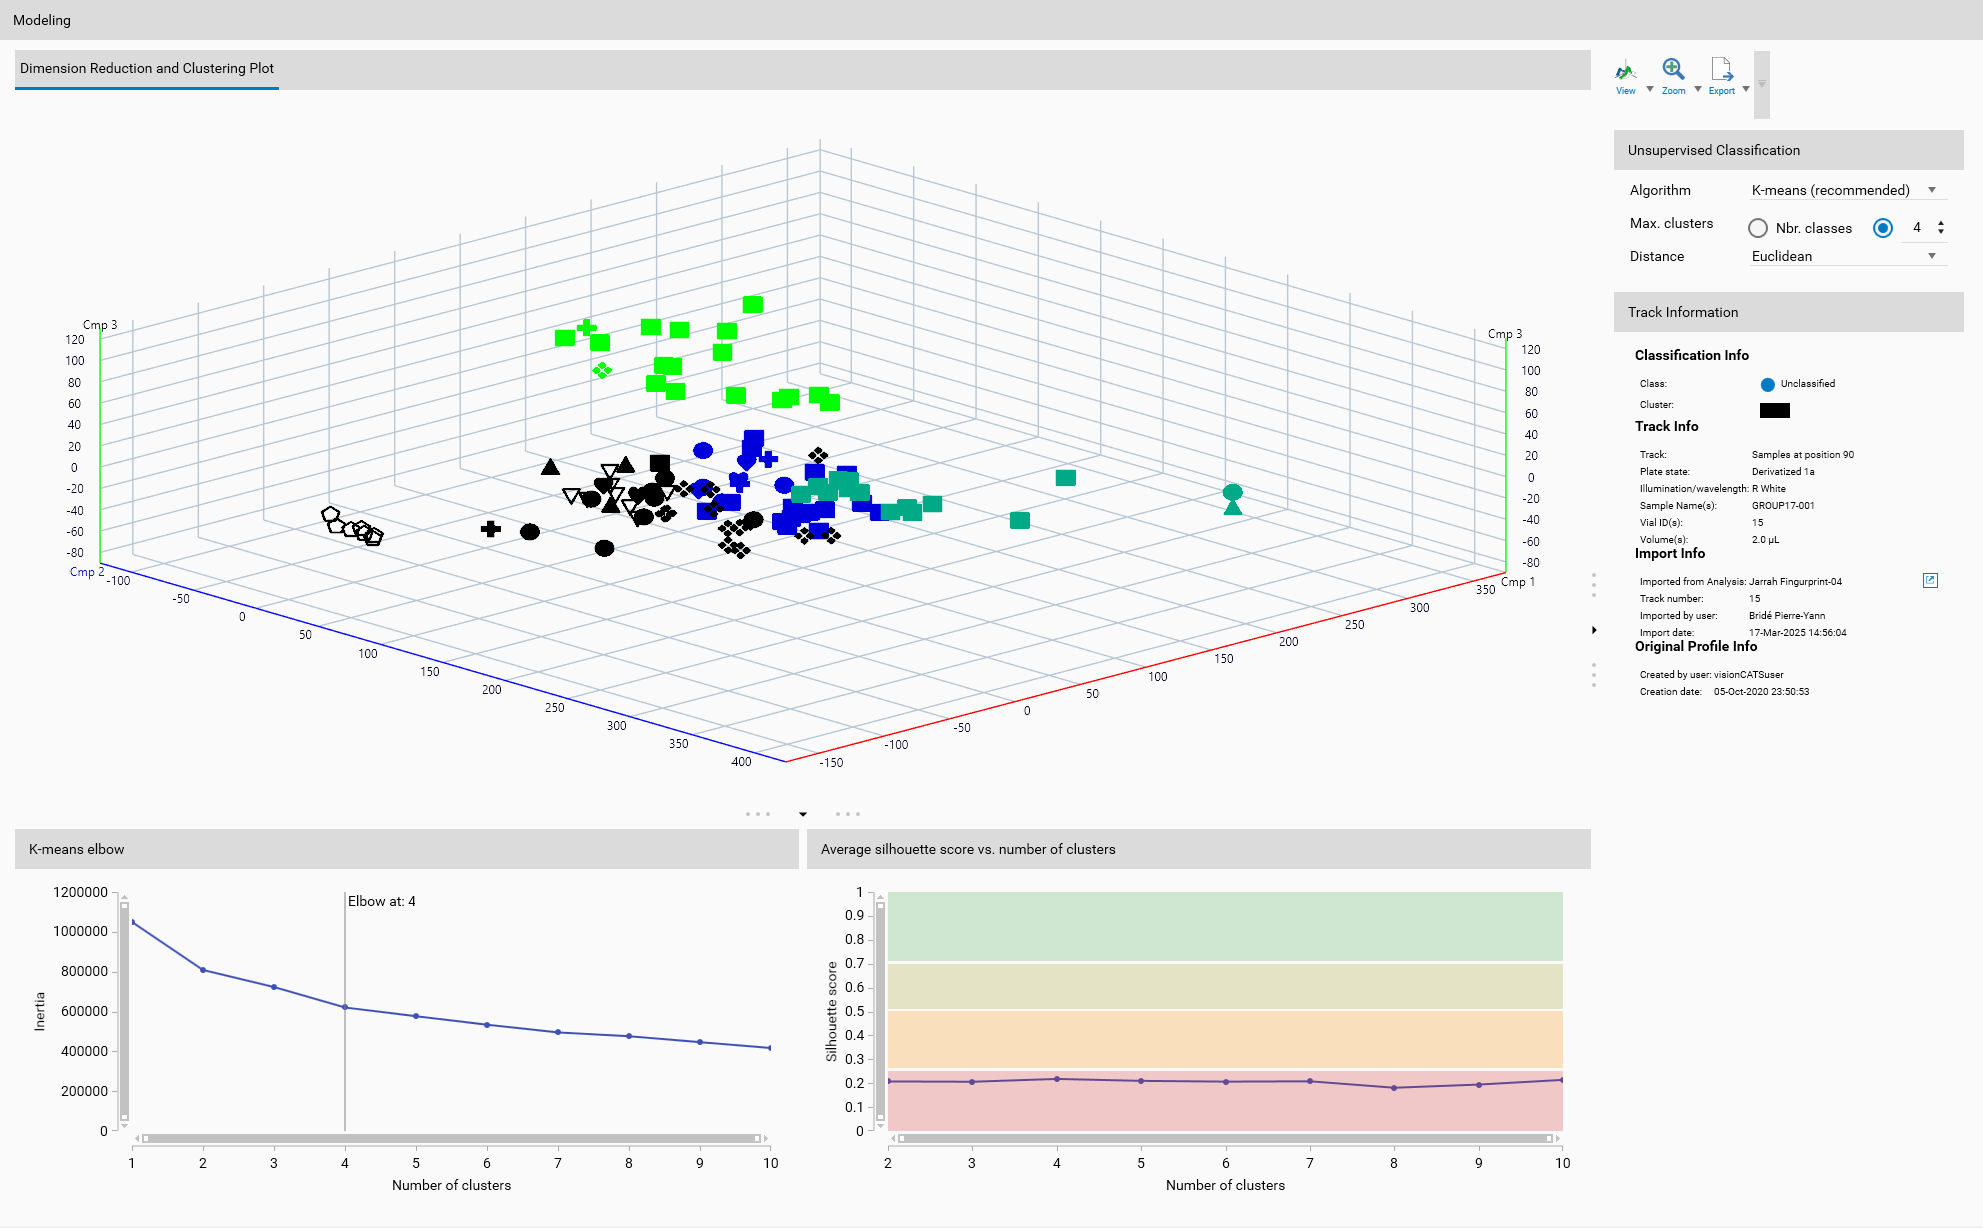
Step 3 — Dimension reduction (unsupervised classification)
Goal: reduce high-dimensional profile/peak vectors to low-dim features for clustering and visualization.
Recommended sequence:
Start with PCA for a fast baseline.
If separation is poor, try UMAP or t-SNE and tune parameters (perplexity, n_neighbors, min_dist).
Inspect the 3D view to confirm clusters are visually separable before clustering or supervised training.
Notes:
For unsupervised workflows, clustering runs on the reduced features — good DR is essential.
For supervised workflows, DR is primarily a visualization aid; training uses the raw/processed features.
Step 4 — Modeling
Unsupervised (clustering):
Choose an algorithm: K-means for compact clusters, DBSCAN for density-based discovery, Hierarchical for nested groups.
Run the clustering algorithm on the reduced features and inspect assignments in the 3D view.
Supervised:
Edit Classes
Open Edit Classes and assign representative tracks to each class (drag/drop or selection controls).
Train
For One-Class: provide representative samples and train the model; review jackknife/QC metrics.
For Multi-Class: train and review confusion/probability outputs and class separation metrics.
Validate
Use cross-validation where available and inspect diagnostic charts (confusion matrices, Hodges–Lehmann).
Training tips:
Retrain after any change to wavelengths, preprocessing, or class membership.
Add more labeled examples when classes are heterogeneous or model performance is poor.
Step 5 — Results and interpretation
Unsupervised:
Each track receives a cluster assignment; cluster numbering is arbitrary — compare clusters to references to interpret meaning.
Supervised One-Class:
Each track is scored against the reference class; set thresholds to flag deviations.
Supervised Multi-Class:
Per-track class probabilities are provided; inspect low-confidence tracks and confusion patterns.
Common actions:
Visualize clusters/classes in the 3D view with coloring and markers.
Export profiles or peak descriptors for offline analysis or reporting.
Result visual:
Troubleshooting quick list
Nothing appears in 3D (Peaks mode): some samples have no detected peaks — switch to Profiles mode.
All samples appear as a single blob: re-evaluate preprocessing, try alternate DR algorithms or tune DR parameters.
Supervised models perform poorly: improve preprocessing, increase labeled training samples, or simplify classes.
Quick checklist before concluding
Did you pick the correct mode (unsupervised/supervised)?
Did you select appropriate wavelengths and data mode?
Did you apply preprocessing in the recommended order?
Did you inspect DR results before clustering/training?
Did you validate model performance using available QC metrics?
If you want the full sub-pages (Preprocessing, Modeling, Results) copied into this VisionCats section so it is fully self-contained, say “copy sub-pages” and I will duplicate those files, adjust image references, and run the build.