Wavelengths
Use the Wavelengths mode to perform multi-wavelength comparison of 2 or 3 given tracks.
Begin by selecting one track to display in at least 2 of the 3 lists:
Use the
and
to move tracks from/to the lists. It is the same operation as dragging/dropping a track between the lists in the Tracks. Use this function in conjunction with the combo box selection to quickly place and select the tracks to compare.
Use the
button to highlight all profiles of the corresponding track.
Select a step in the tree. visionCATS assigns a color for each wavelength. Use the
button to highlight the corresponding profiles to compare.
Note
There is no link between the color of a profile in the Tracks and in the Wavelengths.
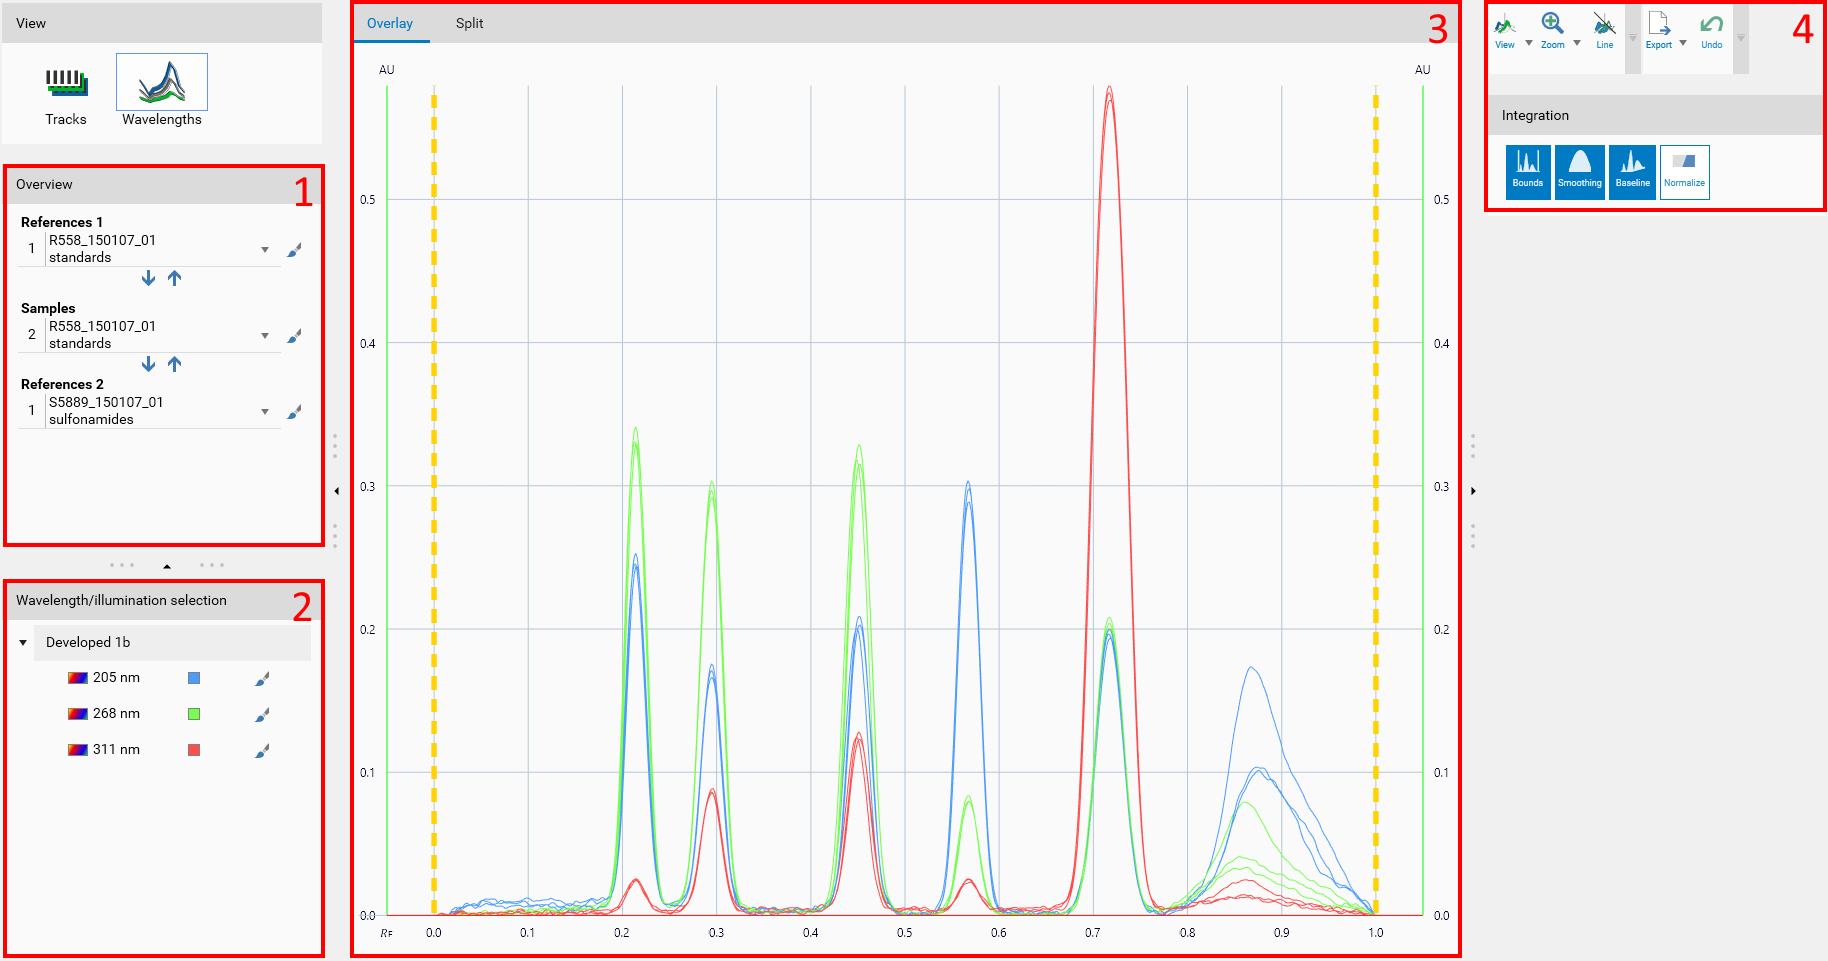
The main view, available in Overlay and Split modes.
Overlay: use this mode to see all the profiles of the selected tracks in the same graph. This way, you can visually identify the differences (peaks positions, heights) between the tracks for each wavelength. The overlay view uses the Profiles viewer.
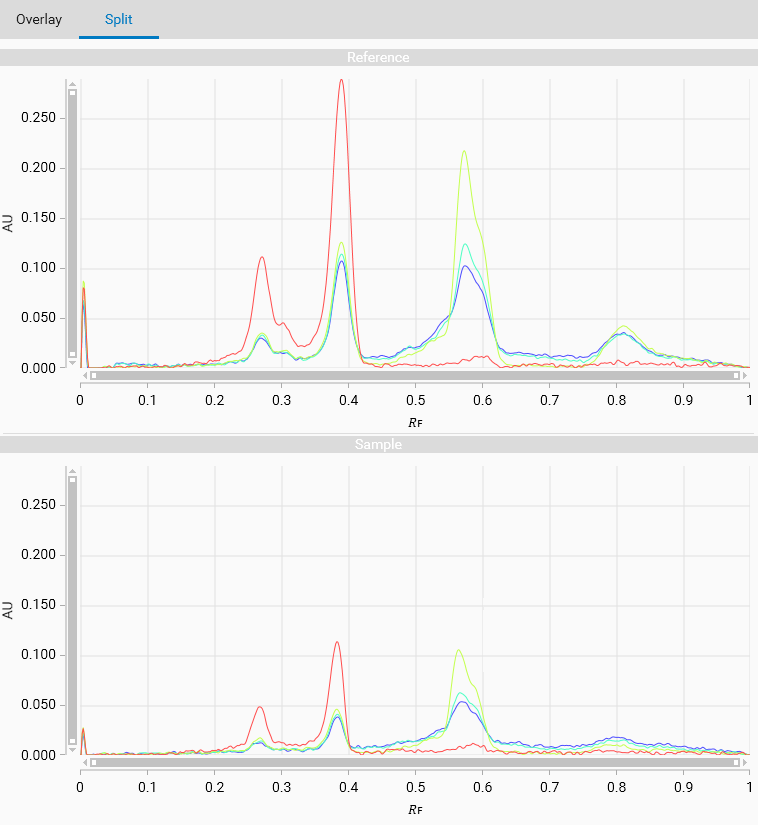
Split: use this mode to see the profiles of each track in a distinct graph. This way, you can compare the evolution of the profiles between the tracks. These 2D views have zoom and help crosshair capabilities.
The tools contain globally the same functions as in the Tracks: easy/expert modes, undo/redo support, export as image function and integration tools.