Preprocessing
Preprocessing parameters and tools
The preprocessing step is crucial for ensuring the quality and reliability of the classification results. It involves several key tasks:
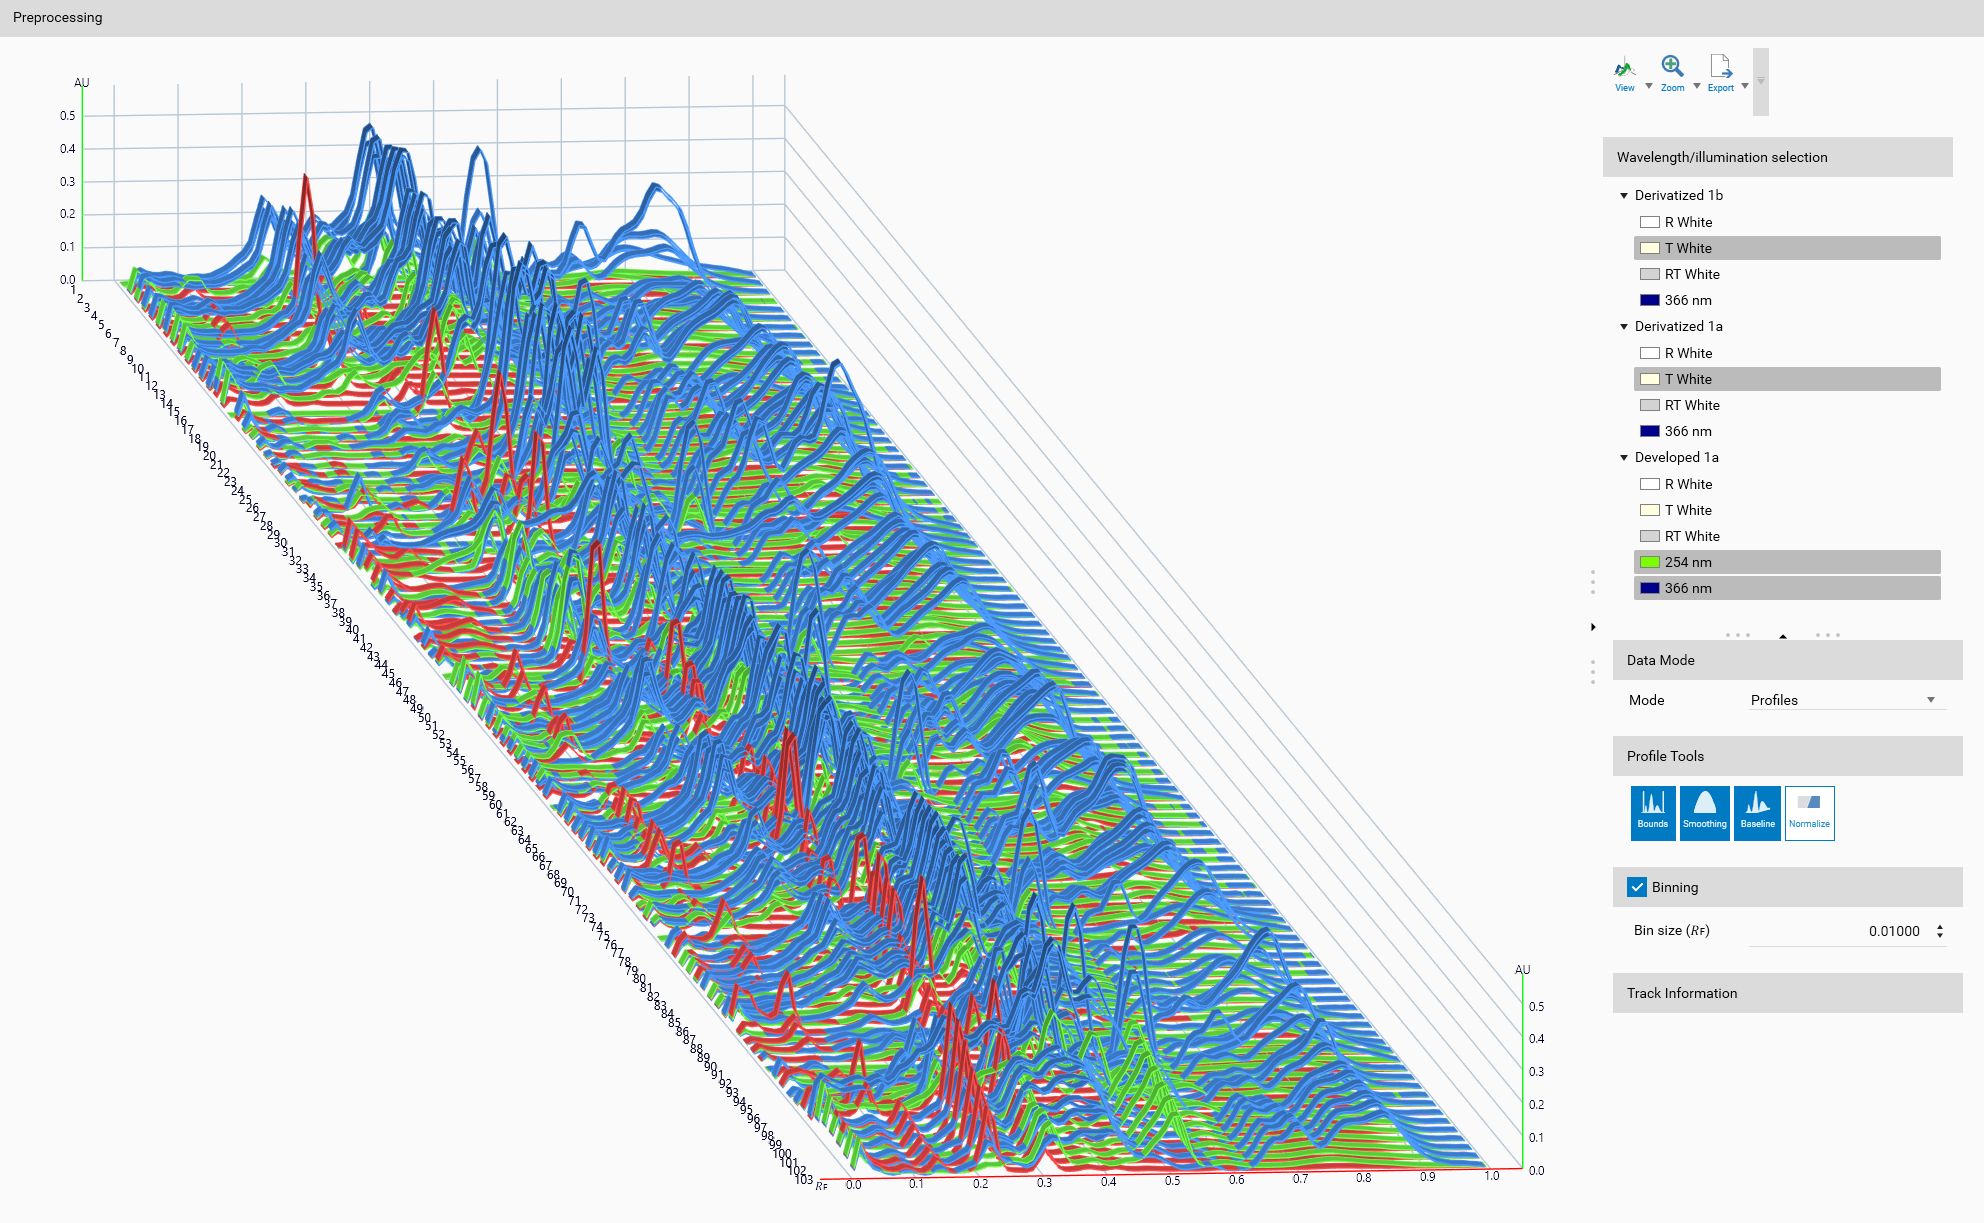
Wavelength/illumination selection
This part allows you to select which wavelength or illumination of a specific step is used for classification. It is possible (and recommended) to select several wavelengths or illuminations at the same time, and the selection is applied to all samples in the comparison (a warning will appears if some sample don’t have a wavelength or illumination).
Important
Depending on the selected wavelength or illumination, the classification results may vary. Ensure that the selected wavelengths or illuminations are appropriate for your analysis.
Important
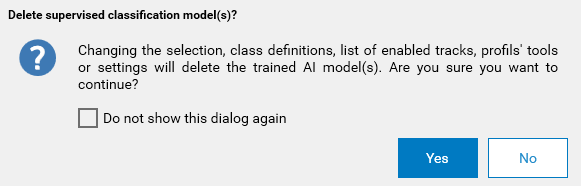
Changing the selection will impact the supervised classification results. If models have already been trained, a popup will appear, asking if you want to delete the existing models, or cancel the changes. If you choose to delete the models, you will need to retrain them after making changes in this view.
To block any changes, you can also lock the model(s) via the Locking model(s).
Data Mode
In Data Mode, you can select which mode to use to suit your data analysis needs. The available options are:
Profiles: The full profiles of each sample of selected wavelength/illumination are used for classification, in color if available, otherwise in grayscale.
Peaks: Peaks are detected in the profiles of each sample of selected wavelength/illumination, and the peak values are used for classification. Each peak is defined by:
Max 𝑅ꜰ
Height
Full width at half maximum (FWHM)
Important
As not all profiles will have the same number of peaks, placeholders will be added for the missing peaks in the profiles. But as theses placeholders will have both height and FWHM equal to 0, they will not mislead the dimension reduction result. Also, an hidden field will indicate which peaks are real and which are placeholders, so that this information can be used in the modeling step to clearly differentiate between real and placeholder peaks.
For sample having no peak at all in any profile, it will not be displayed in the 3D view or in results, as it will not have any data to represent. Switching to the Profiles mode will display these samples again, as they will have their full profiles available.
Depending on your data, you may choose to use either the full profiles or the peak values for classification. The choice of mode will affect the classification results, so it is important to select the appropriate mode based on your data characteristics.
Profile Tools
See Tools for a detailed description of the available profile tools that can be applied during preprocessing.
Binning
Note
Binning is only available when the Profiles data mode is selected.
Binning is a technique used to reduce the dimensionality of the data by grouping adjacent data points into bins. This can help to smooth out noise and improve the performance of classification algorithms. Binning is optional, and you can choose to enable or disable it based on your data analysis needs.
Parameters
Bin size: Specifies the number of adjacent data points to group together into a single bin. A larger bin size will result in more aggressive smoothing, while a smaller bin size will retain more of the original data characteristics. As the bins are on the development axis, the bin size is expressed in 𝑅ꜰ units.
Display
A 3D view is available to visualize the samples in a three-dimensional space. It will help to correctly configure the preprocessing, as it will display the selected wavelengths/illuminations, the profile tools effect, and the binning effect (if enabled).
Important
When the Peaks data mode is selected, the 3D view will display the samples based on their peak values. Therefore, synthetic profiles will be generated from the peak values to represent the samples in the 3D space. These synthetic profiles are created by interpolating between the detected peaks, allowing for a visual representation of the samples based on their peak characteristics. But the following classification steps will not use these synthetic profiles, but the actual peak values (max 𝑅ꜰ, height, FWHM) for classification.
General 3D View features are explained in the Profiles viewer section.
Toolbar
General 3D View tools are explained in the Profiles viewer section.
 Export data Only with Export data option
Depending on the selected Data Mode, export the profiles or the peaks of the selected wavelength/illumination and for all tracks of all samples in the comparison, with all configured preprocessing steps applied.
Track Information
A track can be selected either from the Overview or from the Display. The details of the selected track are then displayed here, like in Track information.